Posted by Lynn | Certified Health Coach and educator | 8-minute read
| Quick answer: Food deserts and health disparities are connected through access, price, and marketing. USDA data show food insecurity in 2024 was 24.4% among Black households and 20.2% among Hispanic households, versus 10.1% among White households. Research links these gaps to the food environment, not to a lack of willpower. |
Key takeaways
- Food insecurity is more than twice as common among Black households as among White households, according to USDA data for 2024.
- Reviews of dozens of studies find that low-income, minority, and rural neighborhoods are most often affected by poor access to healthy food.
- Advertising is part of the environment, too: most of the ad spending aimed at Black audiences promotes candy, sugary drinks, snacks, and cereals.
“Just make better choices.” It sounds simple until you ask who put better choices within reach. Food deserts and health disparities are one story told in two parts: what’s available where you live, and what happens to bodies over time. That story doesn’t start with willpower.
I’m just the messenger. I’ll share what the research found, name the sources, and tell you where the evidence runs out.
Where I’m Coming From
My mission is clear: trustworthy health information for Black and brown communities, because too often the mainstream sources skip us or talk down to us. I’ve taught allied health students for more than ten years and led community health classes in churches for more than five. Teaching keeps me focused on one question: not whether people care about their health, but what is within reach when they try.
When you have to make a decision based on availability, price, and quality, there’s little time for debate over ‘could have or should have’. Why does a pound of hamburger cost $9, and for $5 I can get (4) chicken nuggets, fries, a burger, and a drink? This scenario goes from academic to mathematical acuity. Disinvestment in inner cities exacerbates the problem. Stores closed because, (as I was once told in my retail food sales days) delivery trucks work on a cash basis; EBT card payments don’t pay the bills. The suppliers want cash.
Food Desert, or Food Apartheid?
“Food desert” is the term you’ll see in government reports. It sounds like a natural event, like something that just happened. Activist and farmer Karen Washington has pushed for another term, “food apartheid,” because it points to the whole system: race, geography, and economics that shape who has access to good food and who doesn’t (Washington, Guernica, May 7, 2018). I use both terms in this post so you can follow the research and the conversation.
In USDA’s research, the working definition is more technical. The Food Access Research Atlas flags “low-income, low-access” census tracts, areas where many residents have lower incomes and live far from a supermarket. The distance thresholds are 0.5 or 1 mile in urban areas and 10 or 20 miles in rural areas. In 2010 data, about 2.1 million people lived in low-income tracts more than 10 miles from a supermarket (USDA Economic Research Service, Food Access Research Atlas).
Food Deserts and Health Disparities: What the Numbers Show
Start with food insecurity, meaning households that lacked consistent access to enough food for an active, healthy life. In 2024, USDA’s Economic Research Service found it was 13.7% overall. But the gaps were wide: 24.4% for Black non-Hispanic households, 20.2% for Hispanic households, and 10.1% for White non-Hispanic households (USDA ERS, Household Food Security in the United States in 2024, ERR-358).
One more thing you should know. In September 2025, USDA announced it would discontinue this annual report, according to the Alliance to End Hunger and the Center on Budget and Policy Priorities. That means the 2024 report may be the last of its kind, and fewer numbers means fewer chances to see who’s being left out.
Access: What’s on the Block
A 2009 review in the American Journal of Preventive Medicine pulled together 54 studies on neighborhood food environments. Its finding: low-income, minority, and rural neighborhoods were most often the ones affected by poor access to supermarkets and healthy food, and fast food outlets were concentrated in those same areas (Larson, Story & Nelson, 2009, summarized by Healthy Eating Research).
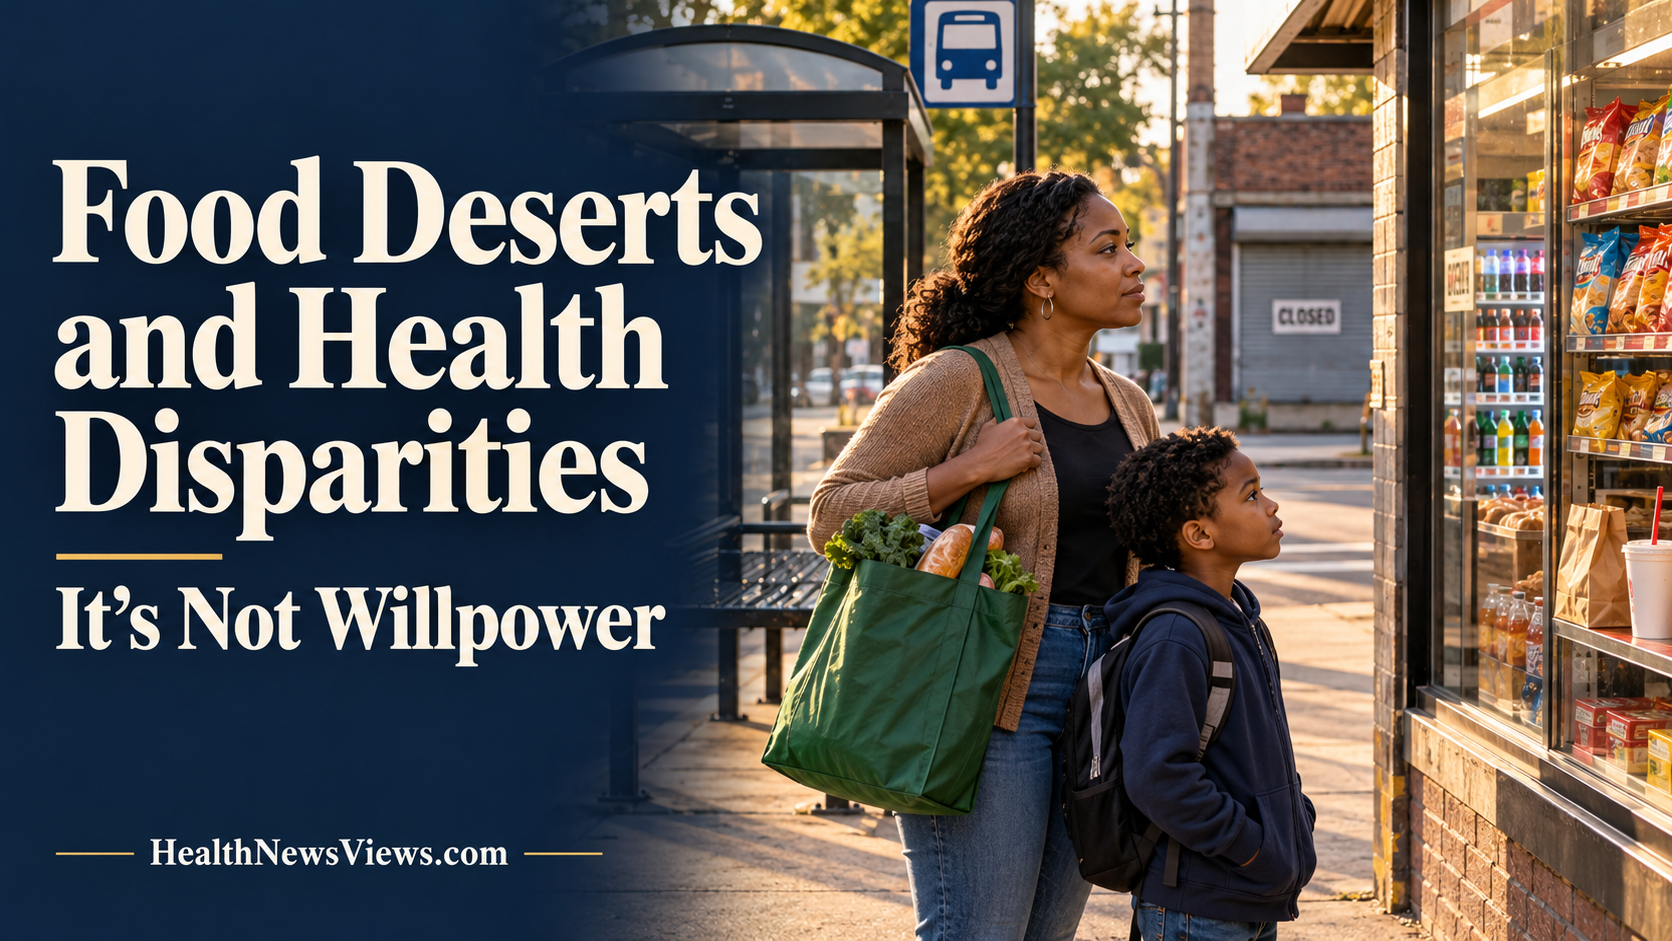
Now do the detective math. If the nearest full grocery store is a long bus ride away, and the corner store sells mostly packaged food, what’s the “choice”? That’s why I keep saying: this isn’t willpower. This is structural. And it’s one reason why ultra-processed food is such a big share of what many families eat.
Marketing: Who Is Being Sold To
The food environment isn’t only about stores. It’s also about the screen. The Rudd Center for Food Policy and Health at the University of Connecticut analyzed 2021 advertising data and reported that 73% of the ad spending on Black-targeted and Spanish-language TV went to candy, sugary drinks, snacks, and cereals. Black youth and adults saw 9% to 21% more food and beverage TV ads than their White peers, and the unhealthy share of targeted ads rose from about 50% in 2017 to 75% in 2021. Nineteen companies accounted for 82% of the food ads on Black-targeted TV (UConn Today, November 2022).
I’m not saying every ad is a plot. I’m saying the pattern is documented, and it’s worth knowing who’s talking to your family and what they’re selling. The same goes for the products themselves, from cereal to the dyes that color it (see Artificial Food Dyes and Kids).
What It Means for Health
Here’s where food deserts and health disparities meet the body. A March 2026 study from the Multi-Ethnic Study of Atherosclerosis (MESA), published in JACC Advances and led by Dr. Amier Haidar, followed 6,814 adults ages 45 to 84. People who ate more than 9 servings of ultra-processed food a day had a 67% higher risk of a major cardiac event than people who ate about 1 serving. Each additional daily serving was linked to roughly 5% or more in added risk. The link looked stronger among Black participants: 6.1% higher risk per serving, compared with 3.2% in non-Black participants (American College of Cardiology press release, March 2026).
The honest limits: this study is observational, and the diet data were self-reported. It can show a pattern, not prove that food alone caused the events.
The disparities show up in other places, too. According to the National Institute of Diabetes and Digestive and Kidney Diseases, Black Americans are more than four times as likely to develop kidney failure as White Americans (NIDDK). Food isn’t the only reason, and I’d never say it is. But diabetes and high blood pressure drive much of that risk, and both are shaped by the food environment and access to care.
What the Research Can’t Tell Us
I owe you the limits. “Food desert” maps don’t capture everything: people shop by car, by ride-share, online, and across neighborhoods. Access alone may not fully explain what people eat. Income, time, culture, and advertising all matter. That’s why I call it a food environment, not a single cause. The claim here isn’t that one thing is to blame. It’s that the system has many parts, and none of them are about your character.
So What Now? Your Do-This-Week Steps
Truth Seekers, you can’t fix food deserts and health disparities alone at the kitchen table. But you can work with what you have, and push for what you need.
- Work with the store you have. Frozen vegetables, canned beans, and plain oats are often easier to find and keep. Learn to read the label (here’s how) and compare two versions of the same item.
- Look for added options. Ask about farmers’ markets, community gardens, church or neighborhood pantries, and SNAP or WIC benefits you may qualify for.
- Use the facts at the table. Share one thing from this post with someone who says it’s “just a choice.”
- Speak up locally. Ask your city council, school board, or church about food access in your area. Change here happens block by block.
- Bring it to your doctor. If you have diabetes, high blood pressure, or kidney concerns, tell your care team about your food access, too. It’s part of your health picture.
Frequently Asked Questions
What is a food desert?
A food desert is a low-income area where residents have limited access to a supermarket or other source of affordable, healthy food. In USDA’s Food Access Research Atlas, low-access is measured by distance, using 0.5 or 1 mile in urban areas and 10 or 20 miles in rural areas.
What is the difference between a food desert and food apartheid?
Food desert is the common government term. Activist Karen Washington prefers food apartheid because it looks at the whole food system, including race, geography, and economics, rather than suggesting the problem is natural.
How does food insecurity differ by race in the U.S.?
According to USDA, food insecurity in 2024 was 24.4% among Black non-Hispanic households, 20.2% among Hispanic households, and 10.1% among White non-Hispanic households, compared with 13.7% overall.
Are unhealthy food ads targeted at Black and Hispanic communities?
The Rudd Center found that 73% of ad spending on Black-targeted and Spanish-language TV went to candy, sugary drinks, snacks, and cereals, and Black youth and adults saw 9% to 21% more food and beverage TV ads than their White peers.
Do food deserts and health disparities affect chronic disease?
Research links poor food access and a heavily ultra-processed diet to higher risk of conditions like heart disease, but most studies are observational and cannot prove cause. Income, time, advertising, and access to health care also play a role.
This article is for educational purposes only and is not a substitute for medical advice. I’m an educator and health coach, not a physician. Your doctor or a registered dietitian knows your numbers, your history, and your body. Talk to them before making changes based on anything you read here. The choice is yours.
I’m just sayin’.
Sources and Further Reading
- Rabbitt MP, et al. Household Food Security in the United States in 2024 (ERR-358). USDA Economic Research Service, December 2025.
- USDA Economic Research Service, Food Access Research Atlas (low-income, low-access tract definitions and 2010 data).
- Alliance to End Hunger and Center on Budget and Policy Priorities, reports on USDA’s September 2025 announcement that it would discontinue the household food security report.
- Larson NI, Story MT, Nelson MC. “Neighborhood environments: disparities in access to healthy foods in the U.S.” American Journal of Preventive Medicine, 2009. Summary: Healthy Eating Research.
- UConn Rudd Center for Food Policy and Health, “New study shows unhealthy food advertising continues to disproportionately target consumers of color”, UConn Today, November 2022.
- Haidar A, et al. Ultra-processed food intake and cardiovascular events in the Multi-Ethnic Study of Atherosclerosis. JACC Advances, 2026. American College of Cardiology press release, March 2026.
- Washington K. Guernica, May 7, 2018, on “food apartheid.”
- National Institute of Diabetes and Digestive and Kidney Diseases, “Kidney Disease Statistics for the United States”.
Want the Whole Case File?
Food: The Final Frontier goes deeper on exactly this: what’s really in our food, how it connects to the chronic disease numbers we keep watching climb, and what you can do about it, in plain English. Get it at foodthefinalfrontier.com or on Amazon.
About Lynn
Lynn Peterson is a certified health coach, educator, and the author of Food: The Final Frontier. She has taught more than 3,000 allied health students, led community health classes in churches for more than five years, and hosts the Health News & Views podcast, with more than 120 episodes. She is not a physician. She reads the research, explains it plainly, and sends you back to your own doctor for the personal call. Her mission is clear, trustworthy health information for the communities that mainstream sources too often overlook.